主题
Nginx 日志采集与分析:Vector + ClickHouse + Grafana 全流程实战
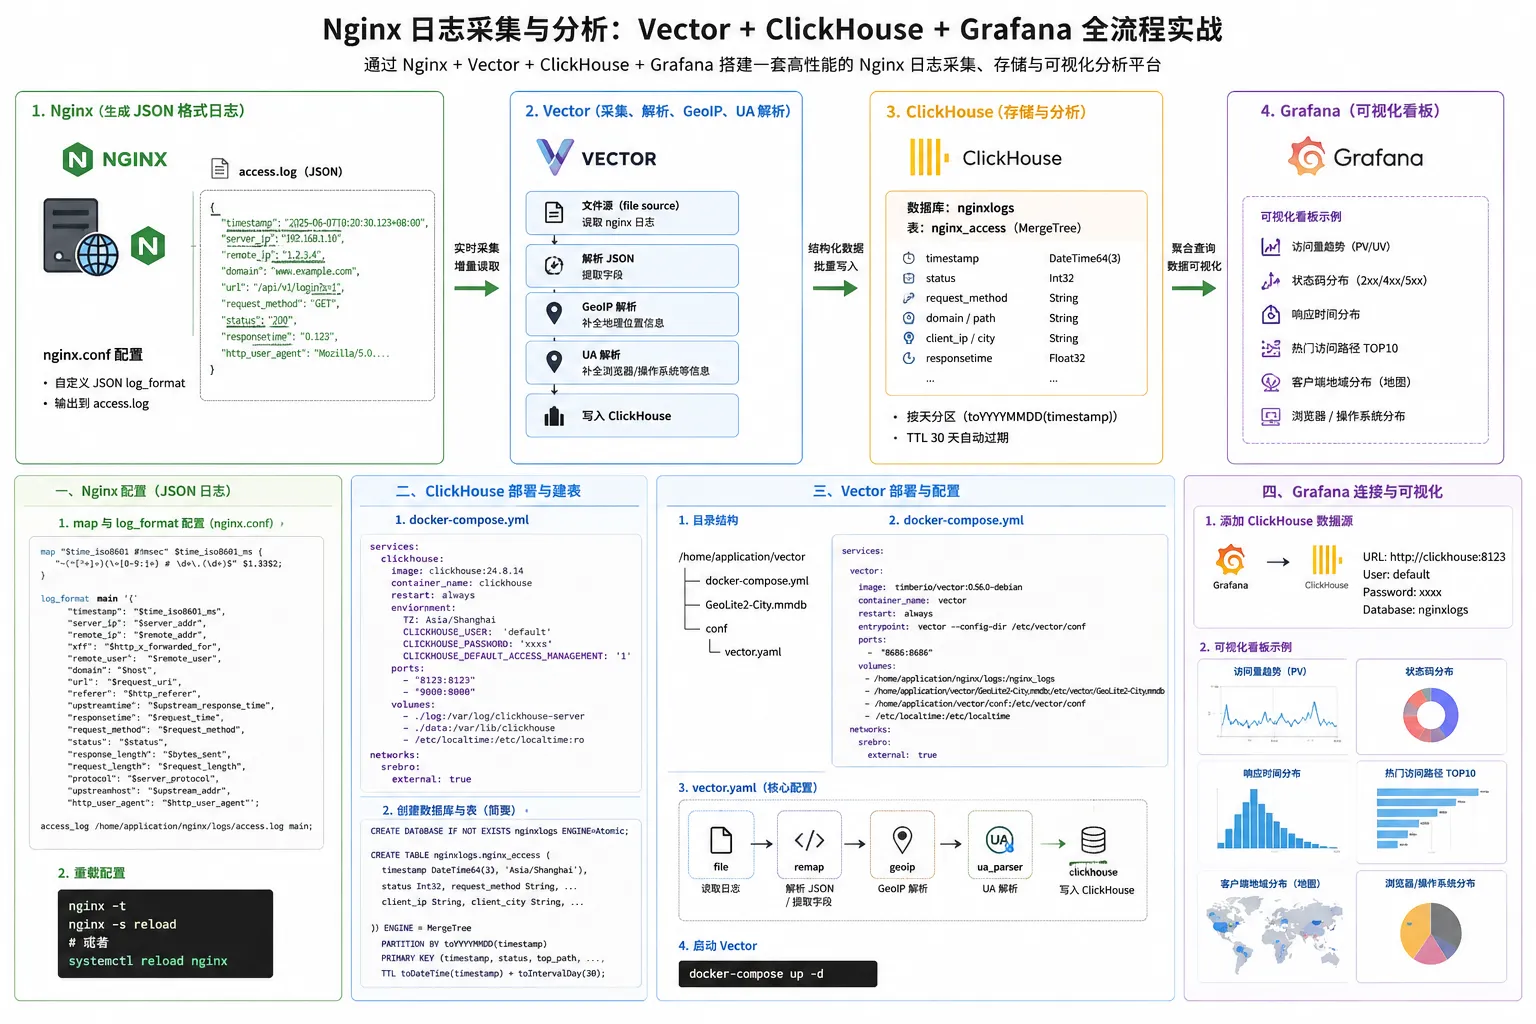
本文介绍如何通过 Nginx + Vector + ClickHouse + Grafana 搭建一套高性能的 Nginx 日志采集、存储与可视化分析平台。架构上由 Nginx 生成 JSON 格式的访问日志,Vector 实时采集并解析、补充 GeoIP 与 UA 信息,写入 ClickHouse 进行存储与聚合分析,最终由 Grafana 呈现可视化看板。
整体架构
Nginx (生成 JSON 格式日志)
    ↓
Vector (采集、解析、GeoIP、UA 解析)
    ↓
ClickHouse (存储与分析)
    ↓
Grafana (可视化看板)一、Nginx 配置
Nginx 安装步骤省略
1.1 自定义 JSON 日志格式
Nginx 默认的 combined 日志格式不易被结构化解析,因此我们自定义 main 格式,将每一行访问日志输出为一条 JSON 字符串。日志中包含毫秒级时间戳、服务器/客户端 IP、域名、URL、响应耗时、状态码、UA 等关键字段。
1.2 配置 nginx.conf
bash
vim /home/application/nginx/conf/nginx.conf在 http {} 块中增加 map 与 log_format 配置(建议放在已有的 http {} 顶部位置,避免覆盖其他站点使用的格式):
nginx
map "$time_iso8601 # $msec" $time_iso8601_ms { "~(^[^+]+)(\+[0-9:]+) # \d+\.(\d+)$" $1.$3$2; }
log_format main
    '{"timestamp":"$time_iso8601_ms",'
    '"server_ip":"$server_addr",'
    '"remote_ip":"$remote_addr",'
    '"xff":"$http_x_forwarded_for",'
    '"remote_user":"$remote_user",'
    '"domain":"$host",'
    '"url":"$request_uri",'
    '"referer":"$http_referer",'
    '"upstreamtime":"$upstream_response_time",'
    '"responsetime":"$request_time",'
    '"request_method":"$request_method",'
    '"status":"$status",'
    '"response_length":"$bytes_sent",'
    '"request_length":"$request_length",'
    '"protocol":"$server_protocol",'
    '"upstreamhost":"$upstream_addr",'
    '"http_user_agent":"$http_user_agent"'
    '}';
access_log /home/application/nginx/logs/access.log main;说明:
$time_iso8601_ms是通过map指令拼接出来的时间戳(带毫秒、含时区),后续 Vector 会按此格式解析。$http_x_forwarded_for多个代理 IP 时是逗号分隔字符串,Vector 会进一步取第一个作为真实客户端 IP。
1.3 重载配置
bash
# 检查配置语法
nginx -t

# 重载配置
nginx -s reload

# 或者使用 systemd
systemctl reload nginx重载后访问一次站点,确认 /home/application/nginx/logs/access.log 中已经输出 JSON 格式的日志。
二、安装 Docker
Docker 安装步骤省略
三、ClickHouse 部署
3.1 创建部署目录与 docker-compose
bash
mkdir -p /home/application/Database/clickhouse/{data,log}
vim /home/application/Database/clickhouse/docker-compose.ymldocker-compose.yml 内容:
- 需定义 clickhouse 数据库的密码
yaml
services:
  clickhouse:
    #image: clickhouse:24.8.14
    image: docker.cnb.cool/srebro/docker-images-chrom/clickhouse:24.8.14_amd64
    container_name: clickhouse
    restart: always
    environment:
      TZ: Asia/Shanghai
      CLICKHOUSE_USER: 'default'
      CLICKHOUSE_PASSWORD: 'xxxx'
      CLICKHOUSE_DEFAULT_ACCESS_MANAGEMENT: '1'
    networks:
      - srebro
    ports:
      - "8123:8123"
      - "9000:9000"
    volumes:
      - /home/application/Database/clickhouse/log:/var/log/clickhouse-server
      - /home/application/Database/clickhouse/data:/var/lib/clickhouse
      - /etc/localtime:/etc/localtime:ro

networks:
  srebro:
external: true3.2 启动 ClickHouse
bash
cd /home/application/Database/clickhouse
docker-compose up -d3.3 创建数据库与表
进入 ClickHouse 客户端
bash
docker container exec -it clickhouse clickhouse-client --user default --password xxxx执行创建语句
sql
CREATE DATABASE IF NOT EXISTS nginxlogs ENGINE=Atomic;

CREATE TABLE nginxlogs.nginx_access
(
    `timestamp` DateTime64(3, 'Asia/Shanghai'),
    `server_ip` String,
    `domain` String,
    `request_method` String,
    `status` Int32,
    `top_path` String,
    `path` String,
    `query` String,
    `protocol` String,
    `referer` String,
    `upstreamhost` String,
    `responsetime` Float32,
    `upstreamtime` Float32,
    `duration` Float32,
    `request_length` Int32,
    `response_length` Int32,
    `client_ip` String,
    `client_latitude` Float32,
    `client_longitude` Float32,
    `remote_user` String,
    `remote_ip` String,
    `xff` String,
    `client_city` String,
    `client_region` String,
    `client_country` String,
    `http_user_agent` String,
    `client_browser_family` String,
    `client_browser_major` String,
    `client_os_family` String,
    `client_os_major` String,
    `client_device_brand` String,
    `client_device_model` String,
    `createdtime` DateTime64(3, 'Asia/Shanghai')
)
ENGINE = MergeTree
PARTITION BY toYYYYMMDD(timestamp)
PRIMARY KEY (timestamp,
 server_ip,
 status,
 top_path,
 domain,
 upstreamhost,
 client_ip,
 remote_user,
 request_method,
 protocol,
 responsetime,
 upstreamtime,
 duration,
 request_length,
 response_length,
 path,
 referer,
 client_city,
 client_region,
 client_country,
 client_browser_family,
 client_browser_major,
 client_os_family,
 client_os_major,
 client_device_brand,
 client_device_model
)
TTL toDateTime(timestamp) + toIntervalDay(30)
SETTINGS index_granularity = 8192;设计要点:
- 引擎:
MergeTree,适合大规模日志写入与聚合查询。- 分区:按天
toYYYYMMDD(timestamp),便于按天清理和查询。- TTL:30 天自动过期,避免日志无限增长。
- 主键:使用多个常用过滤字段组合,兼顾写入和典型查询。
四、部署 Vector 采集日志
Vector 是一款高性能、可观测性数据管道(由 Datadog/Timber 开发)。这里使用它读取 Nginx 日志,解析 JSON、提取字段、补全 GeoIP 与 UA,然后写入 ClickHouse。
4.1 Vector 部署
创建部署目录与 docker-compose
bash
#创建Vector工作目录
mkdir -p /home/application/vector


#下载最新的GeoLite2库文件
cd /home/application/vector/
wget -O GeoLite2-City.mmdb https://github.com/P3TERX/GeoLite.mmdb/releases/download/2026.06.07/GeoLite2-City.mmdb


vim /home/application/vector/docker-compose.ymldocker-compose.yaml 内容:
yaml
services:
  vector:
    #image: timberio/vector:0.56.0-debian
    image: docker.cnb.cool/srebro/docker-images-chrom/timberio-vector:0.56.0-debian_amd64
    container_name: vector
    hostname: vector
    restart: always
    entrypoint: vector --config-dir /etc/vector/conf
    ports:
      - 8686:8686
    networks:
      - srebro
    volumes:
      - /home/application/nginx/logs:/nginx_logs  # 这是需要采集的日志的路径需要挂载到容器内
      - /home/application/vector/GeoLite2-City.mmdb:/etc/vector/GeoLite2-City.mmdb
      - /home/application/vector/conf:/etc/vector/conf
      - /etc/localtime:/etc/localtime
networks:
  srebro:
external: true注意:
/var/log/nginx是需要采集的 Nginx 日志目录,请根据实际环境修改。access_vector_error.log用来记录解析失败的日志,便于排错。GeoLite2-City.mmdb是 MaxMind 提供的 GeoIP 离线库,用于客户端 IP 城市定位。
4.2 Vector 配置
主配置文件
bash
#创建Vector配置文件目录
mkdir -p /home/application/vector/conf

cat <<-EOF > /home/application/vector/conf/vector.yaml
timezone: "Asia/Shanghai"
api:
  enabled: true
  address: "0.0.0.0:8686"
EOFNginx 访问日志解析配置
bash
cat <<-EOF > /home/application/vector/conf/nginx-access.yaml
sources:
  01_file_nginx_access:
    type: file
    include:
      - /nginx_logs/access.log  # 容器内 Nginx 访问日志路径

transforms:
  02_parse_nginx_access:
    drop_on_error: true
    reroute_dropped: true
    type: remap
    inputs:
      - 01_file_nginx_access
    source: |
      .message = string!(.message)
      if contains(.message,"\\x") { .message = replace(.message, "\\x", "\\\\x") }
      . = parse_json!(.message)
      .createdtime = to_unix_timestamp(now(), unit: "milliseconds")
      .timestamp = to_unix_timestamp(parse_timestamp!(.timestamp , format: "%+"), unit: "milliseconds")
      .url_list = split!(.url, "?", 2)
      .path = .url_list[0]
      .query = .url_list[1]
      .path_list = split!(.path, "/", 3)
      if length(.path_list) > 2 {.top_path = join!(["/", .path_list[1]])} else {.top_path = "/"}
      .duration = round(((to_float(.responsetime) ?? 0) - (to_float(.upstreamtime) ?? 0)) ?? 0,3)
      if .xff == "-" { .xff = .remote_ip }
      .client_ip = split!(.xff, ",", 2)[0]
      .ua = parse_user_agent!(.http_user_agent , mode: "enriched")
      .client_browser_family = .ua.browser.family
      .client_browser_major = .ua.browser.major
      .client_os_family = .ua.os.family
      .client_os_major = .ua.os.major
      .client_device_brand = .ua.device.brand
      .client_device_model = .ua.device.model
      .geoip = get_enrichment_table_record("geoip_table", {"ip": .client_ip}) ?? {"city_name":"unknown","region_name":"unknown","country_name":"unknown"}
      .client_city = .geoip.city_name
      .client_region = .geoip.region_name
      .client_country = .geoip.country_name
      .client_latitude = .geoip.latitude
      .client_longitude = .geoip.longitude
      del(.path_list)
      del(.url_list)
      del(.ua)
      del(.geoip)
      del(.url)

sinks:
  03_ck_nginx_access:
    type: clickhouse
    inputs:
      - 02_parse_nginx_access
    endpoint: http://<clickhouse_host>:8123   # ClickHouse HTTP 接口
    database: nginxlogs                         # ClickHouse 库
    table: nginx_access                         # ClickHouse 表
    auth:
      strategy: basic
      user: default
      password: xxxxxxxx                           # ClickHouse 密码
    compression: gzip

enrichment_tables:
  geoip_table:
    path: "/etc/vector/GeoLite2-City.mmdb"
    type: geoip
    locale: "zh-CN"
EOF关键点说明:
01_file_nginx_access监听文件,Vector 会自动按行读取并保存 offset,重启不会丢数据。02_parse_nginx_access使用 VRL 解析 JSON、拆分 URL、计算duration(自身处理耗时)、补全 UA 与 GeoIP。drop_on_error: true+reroute_dropped: true让解析失败的日志输出到04_out_nginx_dropped,不会污染主流程。03_ck_nginx_access通过 HTTP 接口将结构化日志写入 ClickHouse,使用gzip压缩降低带宽。geoip_table是 enrichment table,在 VRL 中通过get_enrichment_table_record引用。
4.3 运行 Vector
bash
cd /home/application/vector
docker compose up -d
docker logs -f vectorVector 启动成功后。稍等片刻即可在 ClickHouse 中查到数据:
sql
SELECT count() FROM nginxlogs.nginx_access;五、Grafana 配置
Grafana安装步骤省略,本节介绍如何安装 ClickHouse 数据源插件、配置数据源以及导入可视化看板。
5.1 安装 ClickHouse 插件
Grafana 官方仓库的 grafana/grafana 镜像默认没有集成 ClickHouse 数据源,需要安装第三方插件 grafana-clickhouse-datasource:
bash
# 进入 Grafana 容器
docker container exec -it grafana bash

# 安装 ClickHouse 数据源插件
grafana cli plugins install grafana-clickhouse-datasource

# 退出容器并重启 Grafana
exit
docker restart grafana注意:部分较新的 Grafana 版本会要求插件带签名,需使用
grafana cli plugins install <plugin> --pluginUrl <url>或将插件放进GF_PATHS_PLUGINS指定目录;如安装失败请检查网络/镜像源。
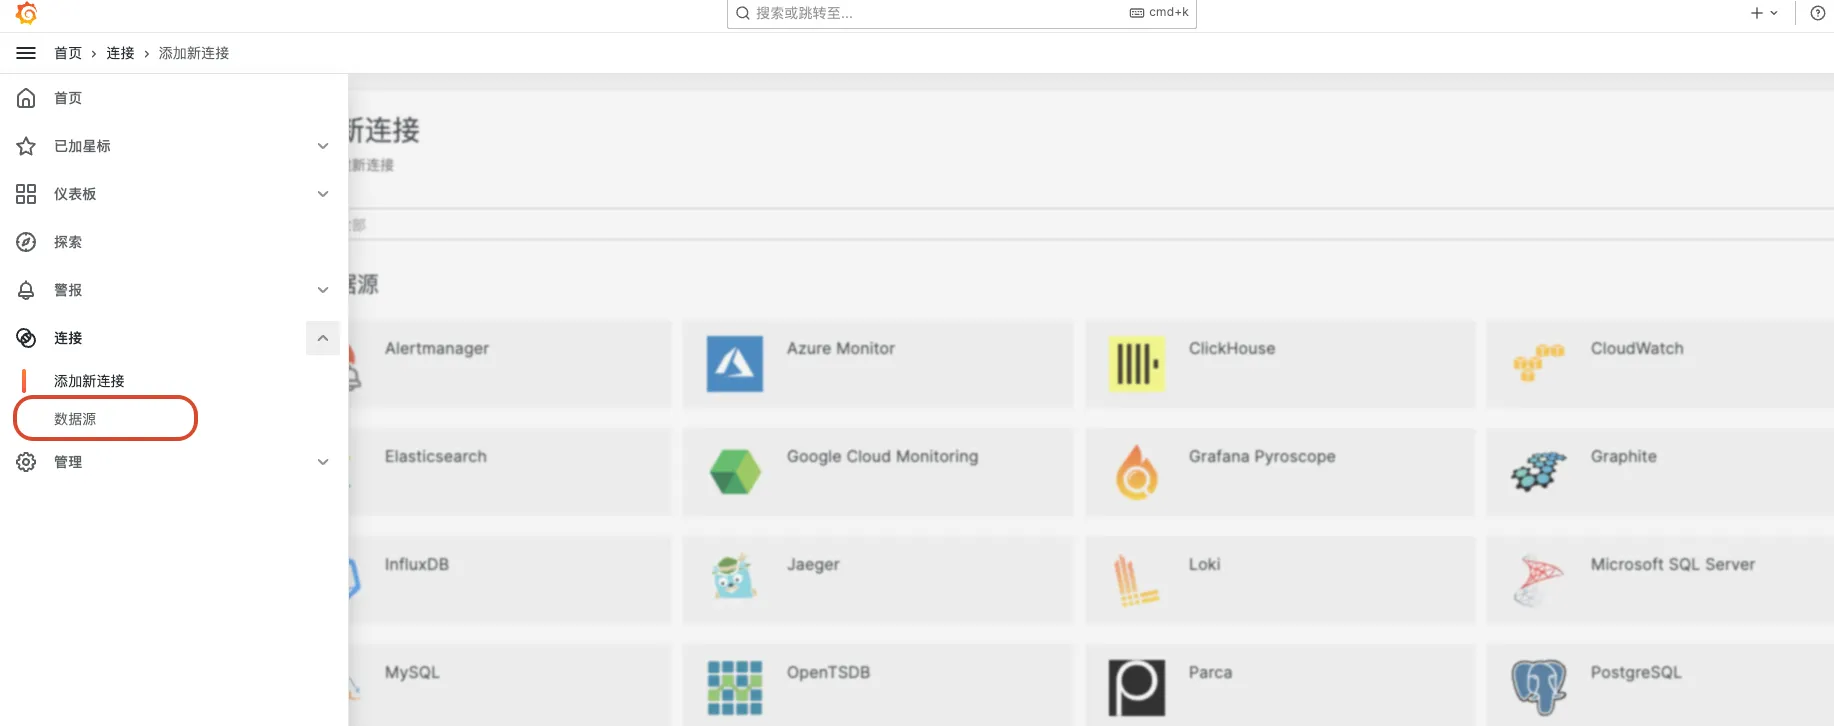
5.2 增加数据源
登录 Grafana,配置数据源,添加新的数据源
主要填写以下内容:
- Server address:
http://<clickhouse_host>:9000 - Auth:Basic auth
- User:
default - Password:
<clickhouse_password>
- User:
- Default database:
nginxlogs默认数据库,一定要填写!!!
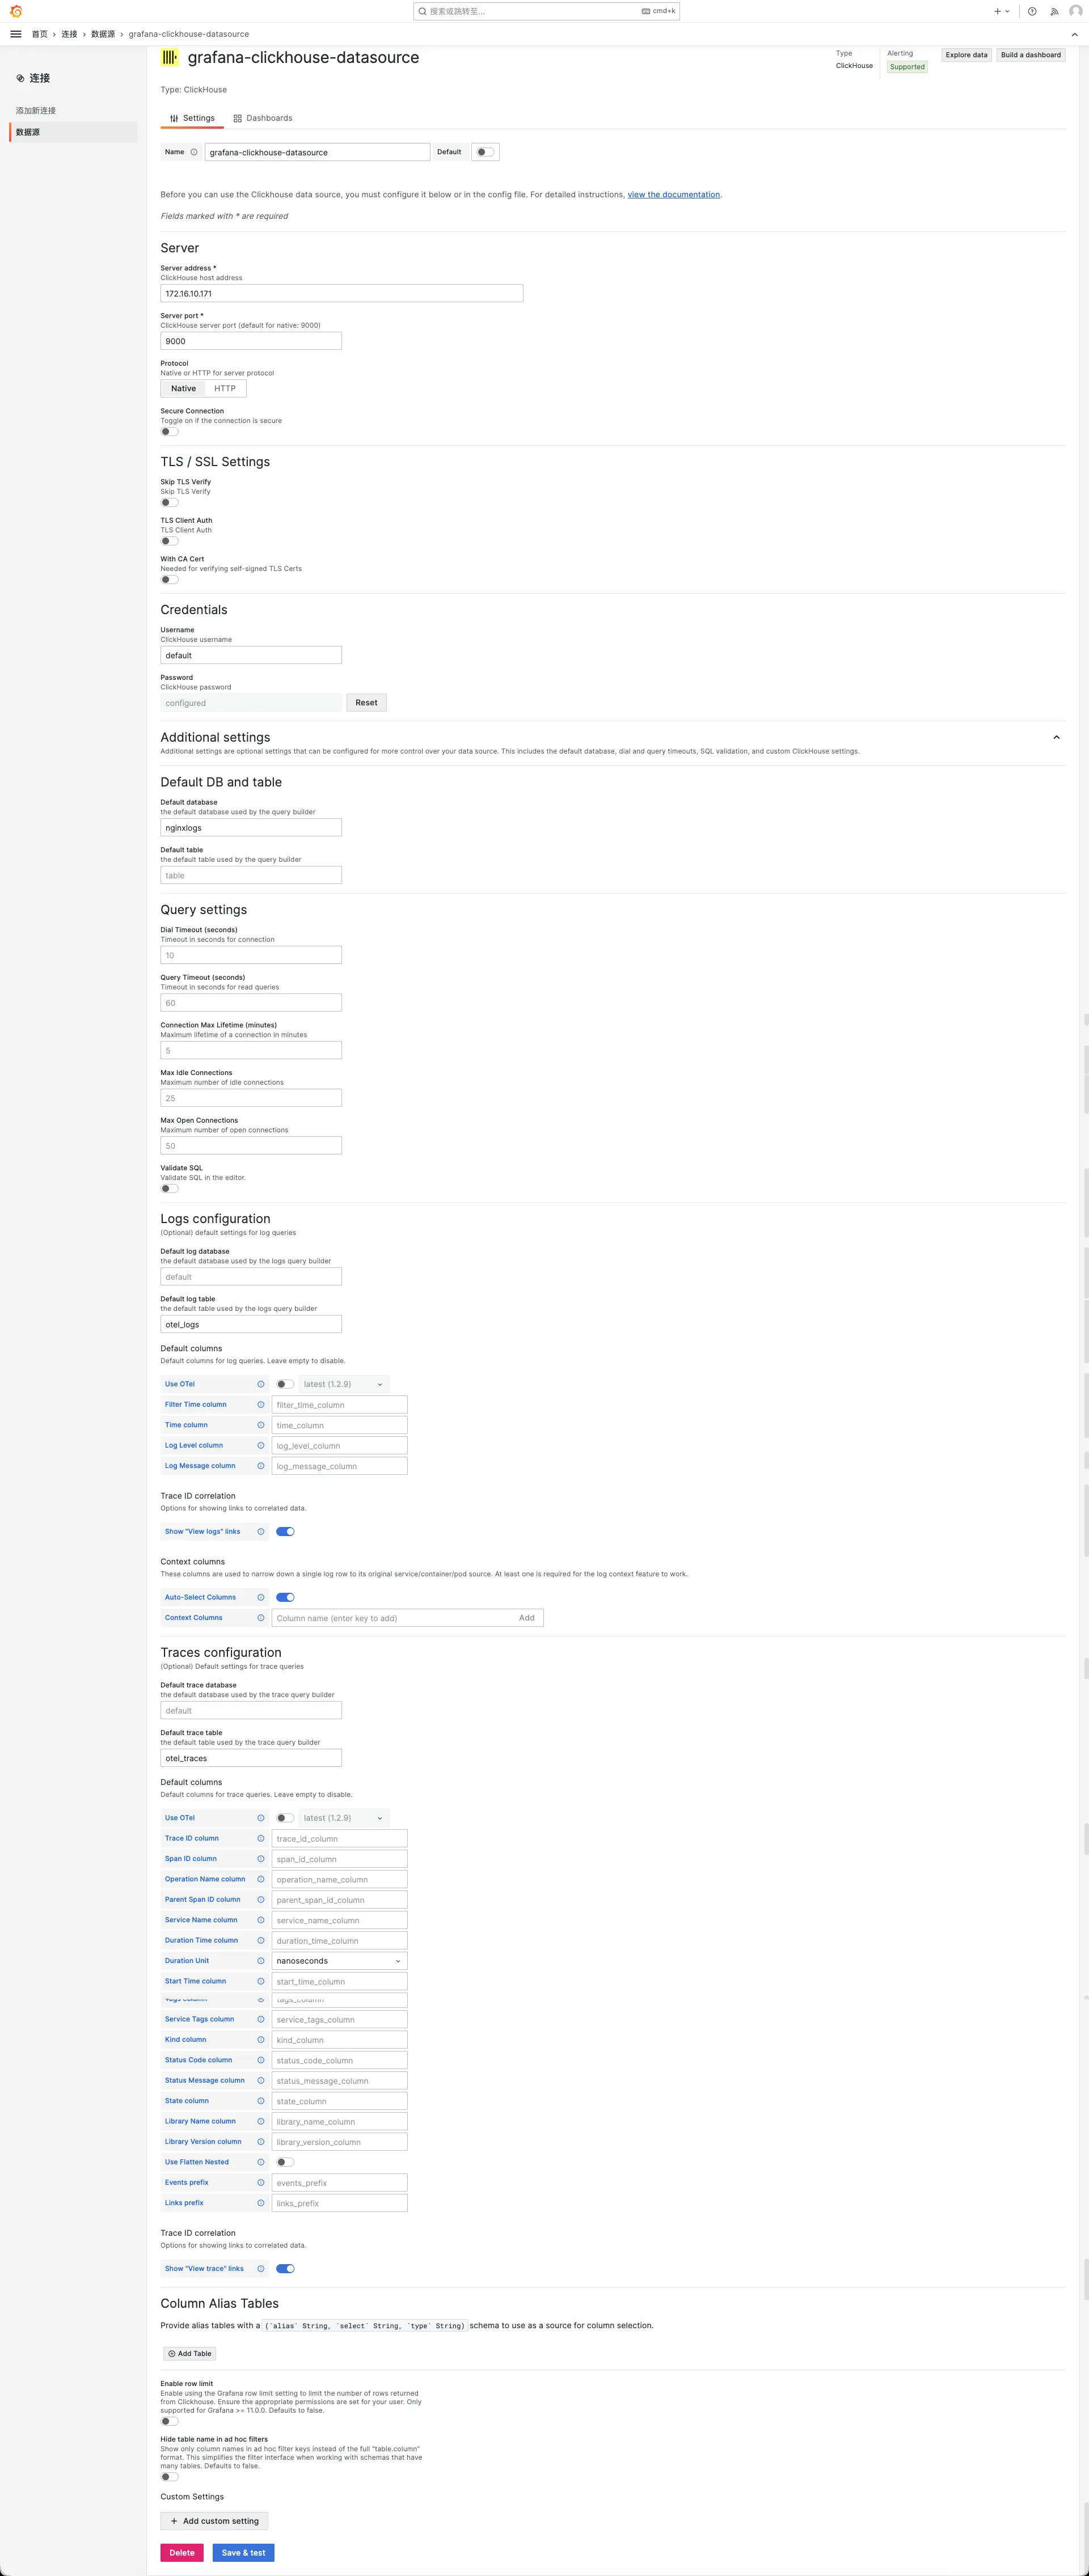
填写完成后点击 Save & test,出现绿色 Data source is working 提示即代表连通。
5.3 导入看板
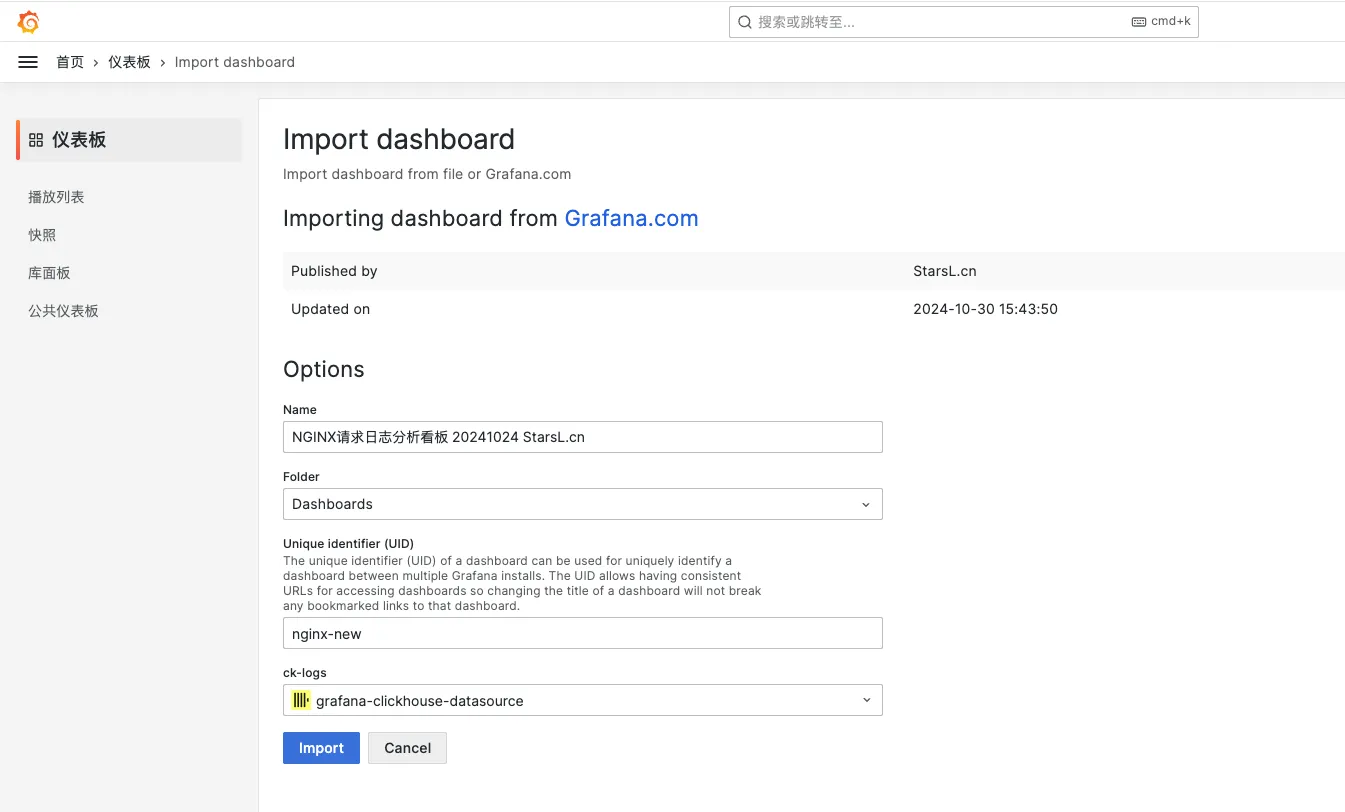
我们使用准备好的 ClickHouse + Nginx 请求日志分析看板进行导入:
- 进入
Dashboards→Import。 - 导入仪表板,id 为:22037
- 选择目标数据源(上面新增的 ClickHouse 数据源)。
- 点击
Import完成导入。
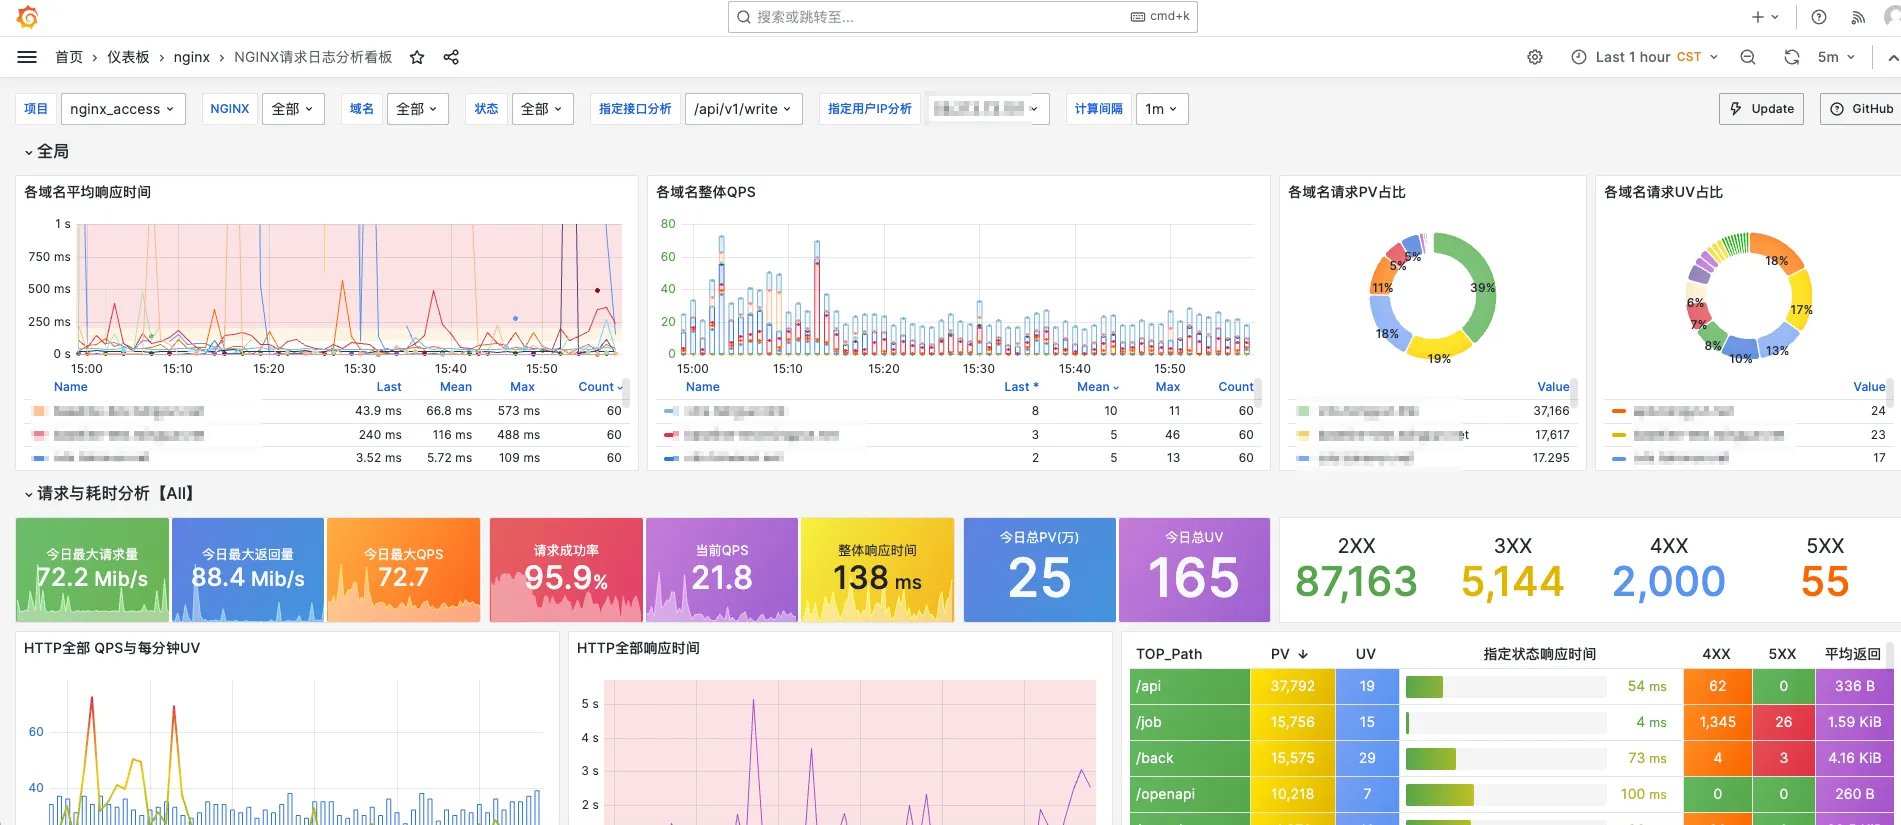
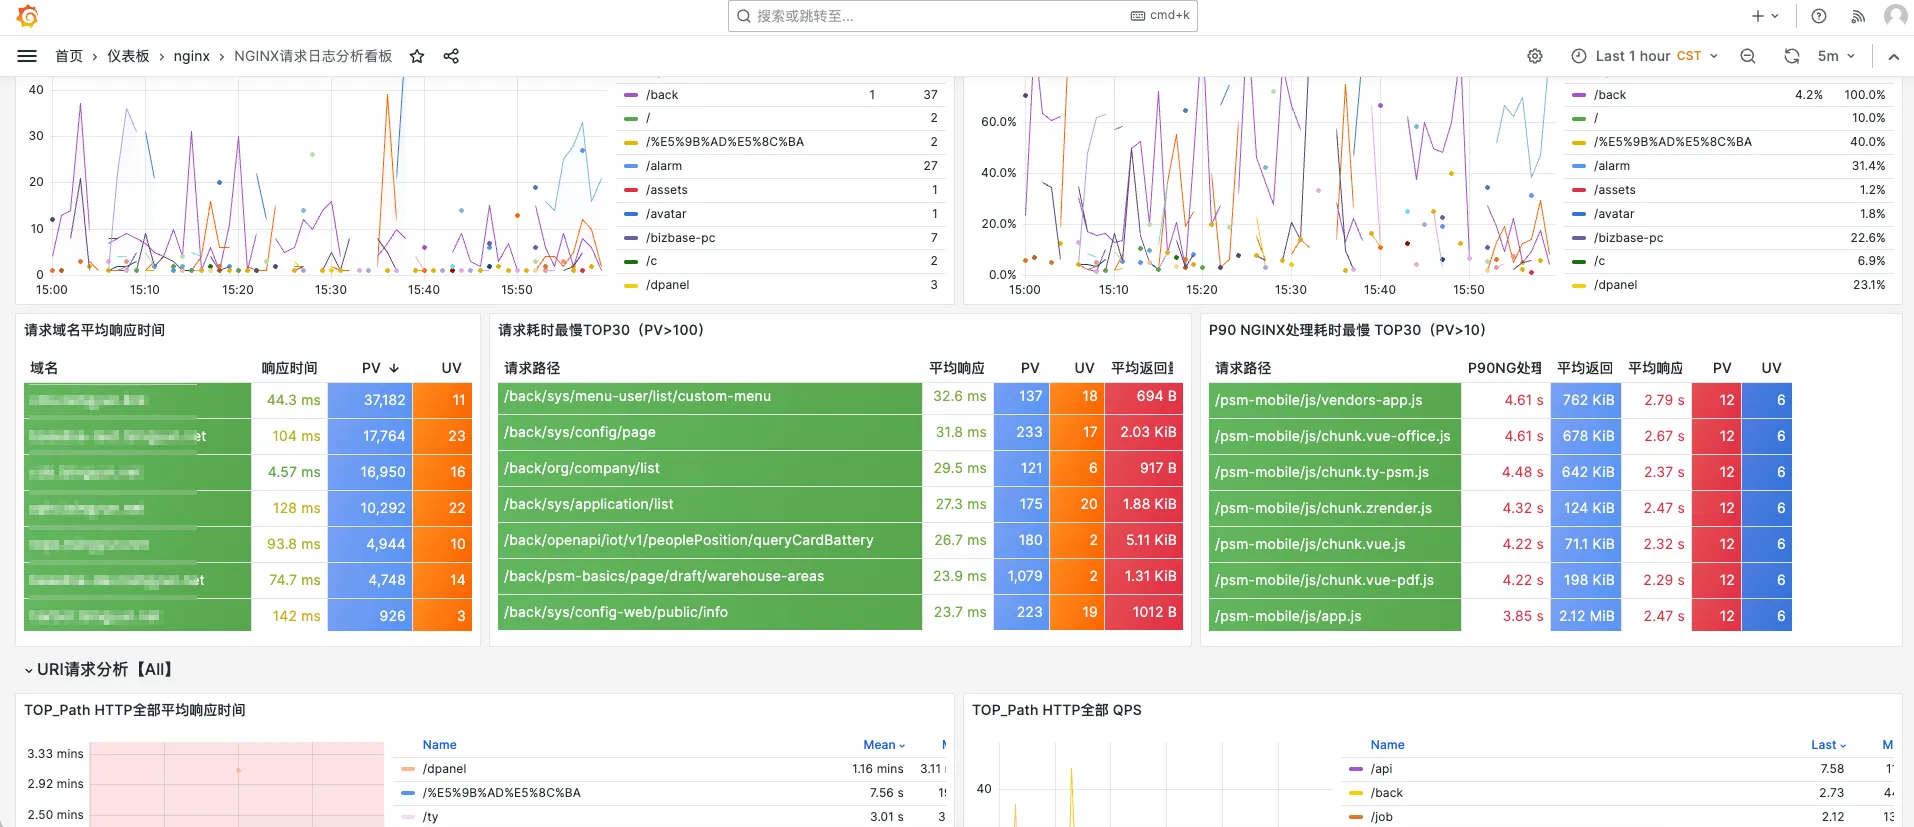
5.4 看板预览
该看板基于 ClickHouse + Vector 的 NGINX 请求日志分析看板,包括 请求与耗时分析、异常请求分析、用户分析、地理位置分布图、指定接口分析、请求日志明细。尤其在异常请求分析方面,总结多年异常请求分析经验,从各个角度设计了大量异常请求的分析图表。
参考文档
- 公众号:https://mp.weixin.qq.com/s/6VSwFCfK0G_QQUjMnLs9Dw
- Vector 官方文档:https://vector.dev/docs/
- ClickHouse 官方文档:https://clickhouse.com/docs/
- Grafana 官方文档:https://grafana.com/docs/grafana/latest/